Reviewed for underwriting accuracy by the RJI Underwriting Research Team | Published: September, 2026 | Last reviewed: September, 2026.
Executive Summary
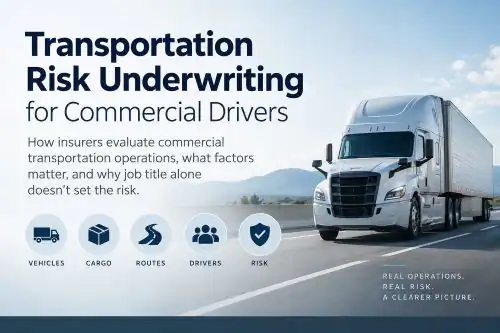
Transportation risk underwriting is how an insurer classifies a commercial transportation operation, reviews performance evidence, and decides whether to offer coverage, on what terms, and at what price. A job title alone does not determine the risk. Vehicle, cargo, route, operator structure, driver quality, claims history, and controls interact, and each insurer weighs them differently.
What Is Transportation Risk Underwriting?
Two drivers can share a license class and a job title and still land in different underwriting conversations. One runs packaged dry goods on a 90-mile daily loop for a fleet with a written safety program. The other pulls a bulk tanker across six states as an owner-operator with two years of operating history. Both ask for coverage. Neither operation can be meaningfully evaluated from the words ‘commercial driver’ alone because the underwriter needs information about the underlying operation.
Transportation risk underwriting is the insurer’s evaluation of a commercial transportation operation, including its vehicles, drivers, cargo, routes, structure, and loss record, to decide whether to accept the risk, on what coverage terms, and under what pricing methodology.
Underwriting is not the same as buying commercial auto insurance. Buying is the transaction: an applicant selects coverages and limits and pays a premium. Underwriting is the evaluation that determines whether that transaction is available and what it contains. The applicant supplies information; the insurer decides what it means.
Eight terms carry most of the weight in this framework, and they are easy to blur:
- Transportation exposure: what the operation does on the road, including miles, routes, loads, schedules, and the circumstances in which a loss can happen.
- Occupational exposure: the hazards that fall on the worker doing the job, such as injury or illness, which are addressed through different coverage lines such as workers’ compensation.
- Regulatory classification: the category that determines which transportation rules apply, such as whether a vehicle counts as a commercial motor vehicle under federal rules. It can overlap with insurance classification, but the two answer different questions.
- Insurance classification: the category a rating plan or insurer assigns to an operation or vehicle, which shapes how the risk is placed, compared, and rated.
- Underwriting: the evaluation and selection decision.
- Rating: the translation of an accepted risk into a premium through the insurer’s own methodology.
- Claims and loss analysis: the review of past claims for frequency, severity, cause, and pattern.
- Coverage eligibility: whether an operation qualifies for a particular program, form, or market.
For the broader framework explaining how insurers evaluate dangerous occupations and where insurance coverage can narrow or fail, see What Is Risk Job Insurance?.
Underwriting translation: a driver’s occupational exposure and an operation’s transportation exposure describe different things. The first is what can happen to the driver. The second is what the operation can do to everyone else on the road and to the freight it carries.
How Does Classification Affect Transportation Insurance?
An insurer cannot evaluate an exposure it has not correctly identified. Classification comes before pricing because it determines which questions get asked, which programs and forms apply, which financial responsibility requirements are in play, and which peer experience the operation is measured against.
Vehicle weight shows how concrete this gets. The federal schedule of minimum financial responsibility in 49 CFR § 387.9 sets its baseline for for-hire carriers of nonhazardous property in interstate commerce using vehicles with a gross vehicle weight rating of 10,001 pounds or more, and FMCSA’s crash statistics use the same line to define a large truck as a truck with a GVWR greater than 10,000 pounds. Commercial auto rating plans then layer on further criteria, including business use and radius.
The federal definition of a commercial motor vehicle in 49 CFR § 390.5 turns on the vehicle and its use: weight, passenger-carrying design or use, and the transport of hazardous materials in quantities requiring placarding. It describes the vehicle and the operation, not the worker’s job title. Regulatory classification decides which transportation rules apply. Insurance classification groups risks for insurance purposes. The two can overlap, and they are not interchangeable.
When the operation on the application differs from the operation on the road, the underwriting rests on the wrong facts. A vehicle used beyond its stated radius, a private carrier hauling for hire, or an unreported second business line each distorts the picture. Premium, terms, and any later coverage position are all built on it.
Underwriting translation: classification is the insurer’s first statement of what it believes it is insuring. Every downstream step inherits any error in it. The full treatment, including DOT classification and classification mismatches, sits in DOT Exposure and Insurance Classification.
Why Commercial Driver Risk Is More Than an Occupation
“Truck driver” names a person’s job. An insurer underwrites an operation: a specific vehicle, carrying specific cargo, over specific routes, under a specific management structure, with a specific record. Two people with the same title can present different profiles on nearly every variable that matters.
| Underwriting variable | Operation A | Operation B |
|---|---|---|
| Vehicle | Single-unit straight truck | Tractor-trailer combination |
| Cargo | Packaged dry goods | Bulk liquid |
| Operating radius | Local loop | Multistate |
| Structure | Fleet with supervision and written driver standards | Owner-operator with limited history |
| Controls | Documented monitoring and maintenance | Limited documentation |
| Loss history | Several minor claims | One serious claim |
| Severity potential | Moderate | High |
Illustrative profiles for explanation, not rating examples. Neither is inherently more insurable; each answers a different set of underwriting questions.
Published rating plans reflect this. The Commonwealth Automobile Reinsurers commercial auto manual, a shared-market plan, names vehicle size, business use, and travel radius as the primary classification criteria for trucks, tractors, and trailers. The insurance glossary maintained by IRMI describes radius in three bands: local, intermediate, and long distance, commonly expressed as up to 50 miles, 50 to 200 miles, and over 200 miles. Band cutoffs and factors are plan-specific, and individual insurers may use their own.
Each variable changes the exposure, and together they change it more than any one does alone. A heavy vehicle with a sound record and a short radius reads differently from the same vehicle with no record and a long one.
How Do Insurers Evaluate Commercial Driver Risk?
Insurer workflows differ. Some underwriters review each submission individually, others work within program guidelines or automated rules, and many combine approaches. The sequence below describes the logic of the evaluation, not a universal procedure or a proprietary formula.
- Classification: What is the insured operation?
- Exposure: What does the operation actually do?
- Evidence: What information shows how the operation performs?
- Underwriting interpretation: How might the insurer read the combined picture?
- Eligibility and terms: What coverage conditions may result?
- Pricing: How does the insurer translate the accepted risk into its own rating methodology?
The exposure step is not about labeling the vehicle. It asks what can happen because the vehicle is used in this particular operation.
What Is the Difference Between Information an Insurer Reviews and Variables It Rates On?
This is the distinction that keeps transportation underwriting statements honest. Four kinds of statement look alike and are not:
| Kind of statement | What it means | Example |
|---|---|---|
| Documented requirement | What a regulation or formal source requires | Federal minimum financial responsibility levels under 49 CFR § 387.9 |
| Documented industry practice | What reliable evidence shows insurers commonly do | Published commercial auto plans classify trucks by size, use, and radius |
| Possible underwriting consideration | What an underwriter may reasonably weigh | Inspection history, driver records, maintenance documentation |
| Insurer-specific methodology | What cannot be generalized without evidence | Whether and how a given insurer weights a particular safety dataset in eligibility or pricing |
The existence of a public dataset does not show that an insurer prices on it. A regulation that requires a record does not make that record a rating variable. Claims about insurer behavior need evidence of insurer behavior, and this analysis marks which category each claim belongs to.
State insurance regulators draw the same line in their consumer materials on auto insurance. The NAIC describes underwriting as the insurer’s evaluation of an applicant’s risk and rating as the step that assigns a price based on the expected cost and likelihood of claims, and its consumer resources note that an underwriter draws on the application and on other sources. Those materials are written for consumers and center on personal auto, so they support the underwriting-versus-rating distinction, not any particular commercial transportation practice. Claims history shows the same gap. It is evidence of prior performance, but how a loss reads depends on its type, timing, frequency, severity, and circumstances, and no single reading is universal.
What Factors Affect Commercial Transportation Underwriting?
Eleven dimensions organize the cluster. Each is introduced here by its underwriting role and developed in a dedicated analysis.
How Does Classification and Regulatory Exposure Affect Insurance?
Exposure. The operation’s legal and operating identity: for-hire or private carriage, interstate or intrastate, vehicle weight, property or passengers, cargo class.
Interpretation. The insurer uses this identity to place the risk in a program and to confirm that coverage and any required filings fit what the operation legally is.
Consequence. A different classification can mean a different market, form, or limit floor, and a mismatch can lead to reclassification and can surface at application, audit, or claim. Deeper analysis: DOT Exposure and Insurance Classification.
How Do Safety and Compliance Records Factor In?
Exposure. Inspection outcomes, crash reports, violation records, driver qualification files, and maintenance records.
Interpretation. Evidence of how the operation behaves between claims. Some of it is public federal data; how any individual insurer uses it is insurer-specific.
Consequence. Consistent evidence supports the applicant’s stated profile. Inconsistent evidence can prompt questions, added documentation, or changed terms. Deeper analysis: FMCSA Safety Measurement System and ELD Compliance in Underwriting.
How Does Operator Structure Change the Risk?
Exposure. Whether one owner drives the truck, a small carrier employs a few drivers, or a fleet runs dozens under a safety function.
Interpretation. Structure determines who controls hiring, dispatch, maintenance, and driver monitoring, and how much loss history exists to read.
Consequence. Different structures hand the underwriter different evidence and may fit different programs. Deeper analysis: Owner-Operator vs. Fleet Classification and Insurance.
What Role Does Accident Frequency Play?
Exposure. How often crashes and claims occur relative to miles or units.
Interpretation. Frequency can signal recurring behavior or operating conditions, though small samples call for cautious reading.
Consequence. Elevated frequency can prompt closer review, loss-control conditions, or different terms; a short clean record in a small operation may prove less than it appears. Deeper analysis: how often commercial drivers have accidents and what it means for insurance.
Why Does Collision Severity Matter?
Exposure. The physical consequences when a crash occurs: vehicle weight, speed environment, roadway type, and point of impact.
Interpretation. A low-frequency operation can still carry outsized loss potential.
Consequence. Severity influences limits, deductibles or retentions, and appetite in ways frequency alone does not. Deeper analysis: Collision Severity Modeling for Commercial Drivers.
What Is Third-Party Liability Exposure in Trucking?
Exposure. Injury or property damage to people and property outside the insured vehicle.
Interpretation. Liability losses turn on who is harmed and how claims resolve, not only on damage to the truck.
Consequence. Liability limits are central to program design and to contractual and regulatory compliance. Deeper analysis: Public Liability Severity in Transportation Insurance.
How Does Cargo Change Transportation Insurance Risk?
Exposure. The freight itself: its value, fragility, theft appeal, and temperature or handling requirements.
Interpretation. Cargo loss is a separate exposure from a crash, since theft, spoilage, shortage, and mishandling can occur without a collision.
Consequence. Cargo limits, conditions, and exclusions are underwritten on their own terms. Deeper analysis: Cargo and Freight Liability Underwriting.
How Do Fatigue and Hours-of-Service Risk Affect Commercial Drivers?
Exposure. Driving time, duty schedules, and the dispatch patterns that determine how long drivers stay on the road.
Interpretation. A regulatory and operational question: does the operation’s scheduling support compliant, rested driving?
Consequence. Where evidence raises questions, an underwriter may ask for more documentation on scheduling and compliance. Deeper analysis: Hours-of-Service Fatigue Risk in Commercial Transportation.
Does Driver Health Affect Commercial Transportation Underwriting?
Exposure. A driver’s medical fitness to operate, which is a different question from how many hours the driver works.
Interpretation. Federal physical qualification standards set a floor for interstate drivers; what an insurer reviews beyond certification is insurer-specific.
Consequence. Current medical certification is a documentation item that supports eligibility, and a lapse raises a compliance question. Deeper analysis: Sleep Deprivation and Driver Health Risk.
What Makes Hazmat Transportation a Specialty Exposure?
Exposure. Hazardous materials whose form or quantity magnifies the consequences of a loss, such as fire, release, cleanup, or evacuation.
Interpretation. Federal financial responsibility minimums step up for specified hazardous materials, and underwriting may involve added review of commodity, packaging, routes, and driver training.
Consequence. Program availability, limits, and how pollution-related exposures are handled can differ from general freight. Deeper analysis: Hazmat Transportation Underwriting Explained.
How Does Long-Haul Operation Change the Risk?
Exposure. Extended radius, more miles per unit, more time away from base, and more varied roads and weather.
Interpretation. Radius is a recognized classification input in published rating plans, and it also raises questions about supervision, driver rotation, and fatigue.
Consequence. A different classification band and added questions about routes, rest, and maintenance on the road. Deeper analysis: Long-Haul Driver Risk Underwriting.
How Do Safety and Compliance Records Factor Into Underwriting?
FMCSA describes its Safety Measurement System as a tool used to identify motor carriers for safety interventions, and it has revised the system repeatedly since first implementing it in 2010. That is a stated enforcement purpose, and it does not by itself make SMS an insurance rating tool.
That framing matters for what “available” means. In the same notice, FMCSA states that under section 5223 of the FAST Act it removed SMS percentiles and alerts for property carriers from the public website, while inspection, investigation, crash, and registration data remain publicly available for all carriers. The FMCSA FAST Act page describes the same restriction. So the data an outsider can see is not the same as the score an enforcement system computes.
Electronic logging devices follow the same pattern. The ELD requirements sit in 49 CFR part 395, subpart B, and FMCSA’s own description of its ELD system centers on enforcement: authorized safety officials retrieve and analyze ELD output to check hours-of-service compliance. Whether an insurer requests or uses ELD-derived information is an insurer-specific, and sometimes contract-specific, question.
Four levels need to stay separate:
- Data that may be available: public inspection, crash, and registration records.
- Data that may be reviewed: what an underwriter chooses to look at when evaluating a submission.
- Data that may be relevant: information bearing on whether the applicant’s description of the operation holds up.
- Insurer-specific rating variables: what a given insurer actually incorporates into its methodology, which cannot be inferred from the existence of a dataset.
FMCSA safety and compliance information may form part of the information available for underwriting or risk assessment, although the extent to which individual insurers use particular data points in eligibility or pricing decisions varies.
Underwriting translation: an application describing a well-maintained fleet, paired with a record of repeated vehicle maintenance violations, gives the underwriter a discrepancy to resolve. The discrepancy, not the dataset, is what the underwriter has to resolve. Detailed treatment: FMCSA Safety Measurement System and ELD Compliance in Underwriting.
How Does Fleet Structure Change Transportation Underwriting?
Structure changes who is responsible for the controls an underwriter cares about: hiring standards, dispatch practices, maintenance schedules, and driver monitoring. It also changes how much history exists to evaluate.
Underwriting translation: a fleet with documented driver controls and a stable loss history gives an insurer a different evidence base from an independently operated vehicle with limited historical data.
Neither is the better risk by default. A well-run owner-operator can present cleanly, and a large fleet with weak oversight can present badly. Mixed structures add another layer. An owner-operator hauling under another carrier’s authority and one operating under their own authority can raise different questions about whose controls and whose filings apply, which is why structure has to be disclosed precisely. Classification detail, supervision, and pricing implications are developed in Owner-Operator vs. Fleet Classification and Insurance.
How Do Accident Frequency and Severity Affect Transportation Risk?
Frequency and severity answer different questions. Frequency is how often losses occur. IRMI’s definition frames it as the likelihood that a loss will occur, from low to high. Severity is the financial magnitude of a loss when one occurs.
FMCSA’s Large Truck and Bus Crash Facts 2022 shows why one number cannot describe transportation risk. It counted 5,837 large trucks involved in fatal crashes, an estimated 120,000 in injury crashes, and an estimated 410,000 in property-damage-only crashes. Minor crashes far outnumber fatal ones, but the fatal ones set the scale of the losses that limits must stand behind.
The same report shows frequency and severity diverging by vehicle configuration. Measured per 100 million miles traveled, single-unit trucks had higher involvement rates in injury crashes (42.6 versus 31.9) and property-damage-only crashes (144.5 versus 109.5) than combination trucks, while combination trucks had the higher rate of involvement in fatal crashes (1.93 versus 1.52). These are crash-involvement rates, not insurer loss ratios, and the report does not assign causation or fault. They show that the frequency and severity profiles of two truck types can point in different directions.
| Lower severity | Higher severity | |
|---|---|---|
| Lower frequency | Small local operation with few incidents and modest loss potential | Bulk or heavy-haul operation with rare incidents and large loss potential |
| Higher frequency | Urban delivery operation with frequent minor collisions | High-mileage operation with frequent incidents and large loss potential |
Illustrative combinations, not rating classes.
An underwriter may read the two differently. Frequency tends to become more informative as exposure grows, because larger fleets generate enough events to show patterns. Severity is more volatile: one large loss can dominate a small operation’s record, which makes a short clean history weaker evidence than it looks. Collapsing the two into a single “accident record” hides exactly the difference that drives limits, retentions, and appetite. Detailed treatment: Commercial Driver Accident Frequency and Insurance and Collision Severity Modeling for Commercial Drivers.
How Do Fatigue, Hours of Service, and Driver Health Affect Underwriting?
These are related but separate underwriting questions.
Fatigue and hours of service concern how the operation schedules and records driving time. The evidence is operational: dispatch practices, duty-status records, and compliance history under the hours-of-service rules. The question is whether the operation’s design supports compliant, rested driving. See Hours-of-Service Fatigue Risk in Commercial Transportation.
Driver health concerns whether the individual driver is medically fit to operate. FMCSA sets the minimum physical qualification standards in 49 CFR 391.41 and determines who can perform the exams, while state agencies issue commercial licenses. A medical examiner listed on FMCSA’s National Registry certifies that the driver is physically qualified. See Sleep Deprivation and Driver Health Risk.
A fully hours-compliant driver can still carry a health-related risk, and a medically certified driver can still work an unsafe schedule. Treating them as one question loses both answers.
How Do Collision, Liability, and Cargo Exposure Differ?
Transportation underwriting reaches well beyond damage to the insured truck. Three exposures run side by side and are underwritten separately.
| Exposure | Who or what is harmed | Underwriting question |
|---|---|---|
| Collision | The insured vehicle and its occupants, through crash physics and vehicle damage | How likely and how severe are crashes for this vehicle and use? |
| Third-party liability | People and property outside the insured vehicle | What limits and controls match the harm this operation could cause? |
| Cargo and freight | The goods in the carrier’s custody | What is carried, and what is the carrier answerable for? |
Liability. The people most exposed in a large truck crash are often outside the truck. In 2022, FMCSA’s report records 5,936 deaths in crashes involving large trucks, of which 1,097 were large truck occupants and 672 were nonmotorists such as pedestrians and cyclists. The federal schedule in 49 CFR § 387.9 is a schedule of public liability limits: $750,000 for for-hire nonhazardous property carriers of the covered weight, stepping up to $1,000,000 and $5,000,000 for specified hazardous materials categories. Those figures are floors. A carrier that meets one has satisfied a filing requirement, not an underwriting standard, and contracts with shippers or brokers may call for more. Non-collision liability exposures are developed in Public Liability Severity in Transportation Insurance.
Cargo. Under 49 U.S.C. § 14706, covered carriers are liable for the actual loss or injury to the property they carry. The federal public liability schedule does not address that exposure, so cargo limits, valuation, and conditions are underwritten on their own. See Cargo and Freight Liability Underwriting.
What Makes Hazmat and Long-Haul Transportation Specialty Risks?
Both change the underwriting question enough to need their own analysis.
Hazmat. Hazardous materials magnify consequence. A release can add fire, cleanup, evacuation, and third-party injury to an ordinary collision loss, and the federal schedule reflects this by raising minimum financial responsibility for specified bulk hazardous materials. Underwriters may look harder at the commodity, whether it moves in bulk, routes, driver training, and emergency response practices. See Hazmat Transportation Underwriting Explained.
Long-haul. Distance changes classification and also the operating conditions behind it: more miles per unit, less supervision in real time, more exposure to unfamiliar roads and weather, and more pressure on rest and maintenance. Radius bands are a documented classification input, and the surrounding operational questions are insurer-specific. See Long-Haul Driver Risk Underwriting.
How Does This Framework Apply to Specific Driver Occupations?
This article describes the system. The supporting analyses examine each mechanism: classification and verification, loss frequency and severity, human-factor risk, liability and cargo, and specialty transportation exposure. Occupation-specific pages then apply those mechanisms to individual jobs.
Each occupation inherits a different mix. Truck driver insurance draws on classification, operator structure, frequency, severity, fatigue, and liability. Fuel tanker driver insurance inherits those and adds hazmat, cargo, and heightened severity as specialty exposures. Tow truck operator insurance draws on a different combination: vehicle configuration, roadside operating exposure, third-party liability, frequency, and specialized equipment. Heavy haul operators, bus and motorcoach operators, last-mile delivery drivers, waste and refuse haulers, and hazmat drivers each draw on their own. The occupation title names the job; the inherited mechanisms describe the exposure. That hierarchy keeps every occupation page from rebuilding the same underwriting logic.
What Can Change a Commercial Transportation Underwriting Decision?
Underwriting outcomes come from combinations, not single inputs. Factors an underwriter may weigh include:
- classification and regulatory status;
- driving history and claims history;
- safety and compliance evidence;
- vehicle characteristics;
- cargo;
- operating territory;
- operator structure and driver controls;
- loss frequency and loss severity;
- specialty exposure;
- documentation quality.
Those factors may influence eligibility, the level of underwriting scrutiny, requested documentation, limits, deductibles, exclusions or conditions, pricing, or declination. No single factor automatically produces one outcome.
Context is what moves a factor from one reading to another. One large claim in a five-truck operation with documented corrective action is a different evidence set from repeated mid-size claims in a fleet with no recorded response. The size and maturity of the operation, the type and timing of the losses, changes made after them, and the current structure of the business all shape how a claims history reads. What either produces, whether a condition, a different price, a different market, or a declination, is an insurer decision.
An insurer may also separate a risk that looks difficult because of its exposure from one that looks difficult because the available information is incomplete. Poor evidence does not necessarily mean a poor risk. It may mean the insurer cannot reliably evaluate the risk.
Market consequences. Operations that look similar on paper may be placed in different market segments with different appetite, forms, and pricing methods, and availability, terms, and cost can vary between insurers for the same operation. Market conditions move as well. APCIA’s first-half 2026 industry results found that commercial auto and other casualty lines remain under pressure from growing claim severity, very large jury awards, and higher medical costs. Aon’s Q1 2026 global market overview says continued growth in auto loss severity is pushing up rates and narrowing appetite, especially for large fleets, public transport operators, and risks with heavy hired, non-owned, or contingent exposure. An operation can stay exactly the same while the market’s treatment of it changes, which is another reason no single underwriting rule should be read as permanent or universal.
Where Can Transportation Underwriting Break Down?
Underwriting is only as reliable as the facts underneath it. Six failure paths recur at the system level:
- Classification is inaccurate. Exposure is misrepresented from the first step, and everything built on the classification inherits the error.
- Exposure is incompletely disclosed. Underwriting assumptions may not match actual operations, and the gap can surface at audit or at claim.
- Safety and compliance evidence is inconsistent. Additional underwriting scrutiny may arise when the application and the record tell different stories.
- Loss history is misunderstood. Frequency and severity characteristics may be misread, for example by treating one large loss as a pattern or a thin clean record as proof of stability.
- Specialty exposure is not properly identified. The policy structure may not align with what the operation actually hauls or where.
- Operator structure is misunderstood. Underwriting may not reflect the actual controls and loss experience behind the operation.
Detailed claim breakpoints belong to the supporting analyses. The shared point is that a policy can look sound on paper and still fail the operation it was meant to cover.
What Can Commercial Drivers and Transportation Businesses Do to Improve Underwriting Readiness?
Underwriting readiness means making the operation accurately understandable and supportable with evidence. It does not mean engineering an outcome, and good documentation does not promise a lower premium. It improves the insurer’s ability to evaluate the exposure accurately, which is the precondition for any fair outcome.
- Accurate classification. Confirm vehicle weight, carriage type, and interstate or intrastate status, and reconcile them with what the operation actually does.
- Clear description of operations. State radius, typical routes, states of operation, and how often each vehicle runs.
- Driver records. Keep current license, medical certification, and qualification documentation for every driver.
- Claims and loss documentation. A loss run shows that a claim occurred. Keep the record that explains what happened, the cause, the outcome, any corrective action, and whether the underlying exposure has changed.
- Safety documentation. Be able to demonstrate the controls the operation says it runs: safety programs, driver standards, and how they are enforced.
- Maintenance records. Show scheduled and completed maintenance by unit.
- Training. Document what drivers are trained on and when.
- Compliance documentation. Keep hours-of-service and inspection records organized and consistent with the application.
- Cargo information. Specify commodities, values, and handling requirements, and identify any hazardous materials.
- Operational controls. Describe dispatch, monitoring, and oversight in terms an outsider can verify.
- Separation of business activities. Where an operation runs different lines, such as hauling, brokering, or a separate service business, describe each distinctly rather than blending them.
The aim is not paperwork. It is evidence that lets an insurer tell an operation with documented controls from one whose controls cannot be verified.
Key Takeaways
- Transportation underwriting evaluates an operation, not a job title. Vehicle, cargo, route, structure, driver, claims, and controls interact.
- Classification comes first. The insurer has to know what the operation actually does before it can evaluate the exposure meaningfully.
- The evaluation moves from classification through exposure, evidence, and interpretation to eligibility, terms, and pricing, and insurers run that sequence differently.
- Information an insurer may review is not the same as a variable it rates on. Public safety data and regulatory records are inputs to judgment, not evidence of any insurer’s formula.
- Frequency is how often losses occur; severity is how large they are. They can move independently, and combining them hides what drives limits and appetite.
- Collision, third-party liability, and cargo are separate exposures. Federal minimum financial responsibility is a floor for public liability, not an underwriting standard.
- Fatigue and driver health are distinct questions: how the operation schedules driving versus whether the driver is medically fit.
- Hazmat and long-haul operations change the underwriting question and need dedicated analysis.
- Underwriting can fail where classification, disclosure, evidence, or operator structure is inaccurate or incomplete.
- Accurate classification and clear documentation improve the insurer’s ability to evaluate the risk; they do not guarantee a price.
- Occupation pages apply this framework rather than recreate it.
………………………………………………………………………………………………………………………………………………
Sources & Underwriting References
Regulatory and statutory
- 49 CFR § 387.9, Financial responsibility, minimum levels (eCFR)
- 49 CFR § 390.5, Definitions, including commercial motor vehicle (Cornell LII, Part 390 Subpart A index)
- 49 U.S.C. § 14706, Liability of carriers under receipts and bills of lading (Cornell LII)
- FMCSA, Enhanced Carrier Safety Measurement System (SMS), 89 Fed. Reg. 91874 (Nov. 20, 2024)
- FMCSA notice describing the ELD system and 49 CFR part 395, subpart B, Federal Register (May 17, 2024)
- FMCSA, Where can I find information on FMCSA medical exams and regulations for commercial drivers (49 CFR 391.41)
- FMCSA, FAST Act CSA page (SMS public display of property carrier percentiles and alerts)
Statistical
- FMCSA, Large Truck and Bus Crash Facts 2022 (September 2025):
Insurance regulatory
- NAIC, Auto Insurance (underwriting and rating)
- NAIC, Regulatory Resources for Consumers on Personal Lines Pricing and Underwriting (2022)
Insurance-industry
- Commonwealth Automobile Reinsurers, Commercial Automobile Insurance Manual, Section III (truck, tractor, and trailer classification)
- IRMI, Radius class
- IRMI, Frequency
- APCIA first-half 2026 industry results (GlobeNewswire release, Sept. 2, 2026)
- Aon, Q1 2026 Global Insurance Market Overview:
Research & Underwriting Methodology
Regulatory statements were drawn from federal sources (the Code of Federal Regulations, the United States Code, and FMCSA publications) and stated only as far as those sources support. Crash statistics come from FMCSA’s Large Truck and Bus Crash Facts 2022, the most recent edition located at drafting; the report describes crashes and does not assign causation or fault, and its figures are not insurer loss experience. Injury and property-damage-only counts are national estimates.
Insurance-practice statements are separated into four categories: documented requirement, documented industry practice, possible underwriting consideration, and insurer-specific methodology. Published classification plans are cited as examples of documented practice, not as a universal standard, since individual insurers use their own plans and factors. This analysis makes no claim about any insurer’s rating formula, and it does not infer rating variables from the existence of a public dataset. Illustrative operation profiles are hypothetical and are not rating examples.
The analysis uses U.S. federal transportation regulation as its principal regulatory reference. Transportation regulation, insurance classification, and underwriting requirements can differ by jurisdiction.